Note
Click here to download the full example code
Rio de Janeiro (city) districts
This example will explore the case of getting data from another ArcGIS server.
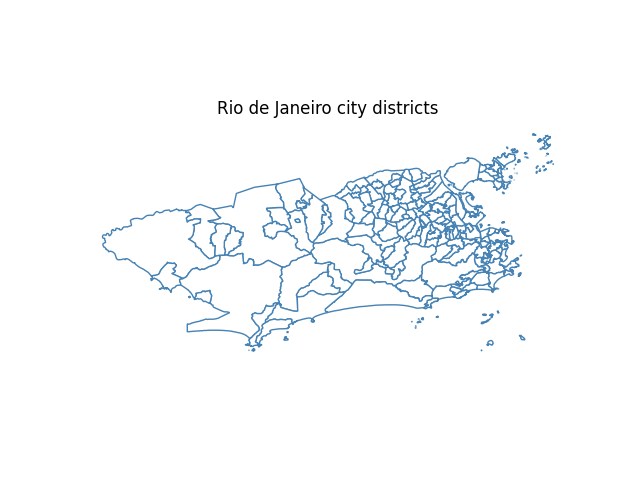
We will use a server that provides data on the city of Rio de Janeiro. Let’s, for example, plot the district divisions.
from mapsbr import arcgis

districts = arcgis.get_map(
    service="Basicos/mapa_basico_UTM",
    layer=15,
    baseurl="https://pgeo3.rio.rj.gov.br/arcgis/rest/services/",
)

import matplotlib.pyplot as plt

districts.plot(color="w", edgecolor="steelblue")
plt.title("Rio de Janeiro city districts")
plt.gca().axis("off")
Out:
(-43.83036038458216, -43.06193412774771, -23.09973631742922, -22.72917666587355)
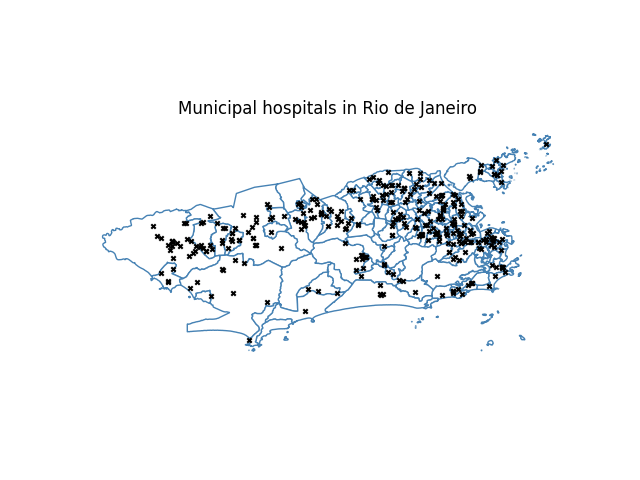
From the same service, you could also plot some interesting things like the geographical distribution of municipal hospitals.
rj_districts = districts.plot(color="w", edgecolor="steelblue")

arcgis.get_map(
    service="Basicos/mapa_basico_UTM",
    layer=7,
    baseurl="https://pgeo3.rio.rj.gov.br/arcgis/rest/services/",
).plot(ax=rj_districts, color="black", marker="x", markersize=10)

plt.gca().axis("off")
plt.title("Municipal hospitals in Rio de Janeiro")
Out:
Text(0.5, 1.0, 'Municipal hospitals in Rio de Janeiro')
Total running time of the script: ( 0 minutes 4.903 seconds)
Estimated memory usage: 24 MB