Note
Click here to download the full example code
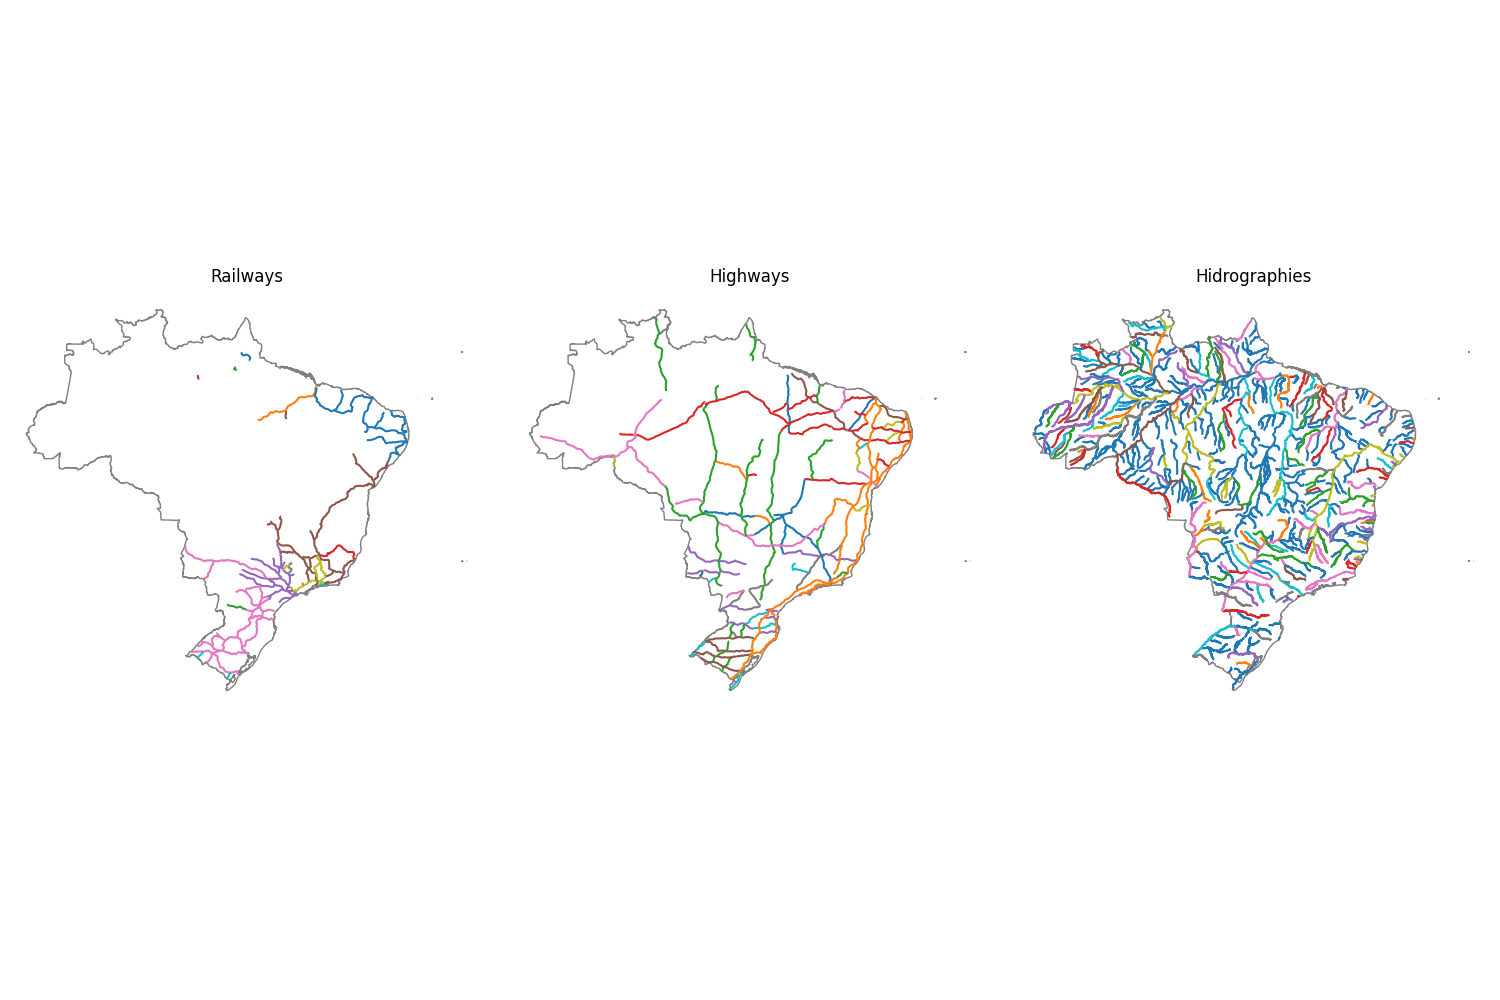
Highways, railways and hidrographies
In this example, we’ll get and plot brazil highways, railways and higrographies. All we need to do is request the right layer in the right IBGE ArcGIS server service.
from mapsbr import ibgemaps, arcgis

railways = arcgis.get_map("BASEMAP", layer=2)
highways = arcgis.get_map("BASEMAP", layer=3)
hidrographies = arcgis.get_map("BASEMAP", layer=4)

transports = railways, highways, hidrographies
titles = ["Railways", "Highways", "Hidrographies"]
Once we have it, let’s now plot it.
import matplotlib.pyplot as plt

fig, axes = plt.subplots(nrows=1, ncols=3, figsize=(15, 10), constrained_layout=True)
br = ibgemaps.get_map("BR")
for ax, transport, title in zip(axes.flat, transports, titles):
    br.plot(ax=ax, color="white", edgecolor="gray")
    transport.plot(ax=ax, column=transport.columns[1])
    ax.set_title(title)
    ax.axis("off")
Total running time of the script: ( 0 minutes 9.583 seconds)
Estimated memory usage: 49 MB