Note
Click here to download the full example code
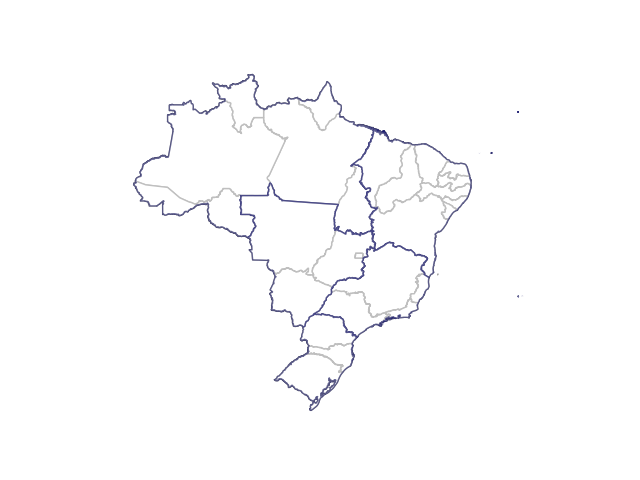
Combining Maps
In this example we’ll show how to combine maps in order to get a more detailed view of Brazil.
A way to plot multiple polygons on top of another is to first plot the more detailed map, e.g., with states, and then plot on top of it the more aggregated map, e.g., with macroregions only, with some transparency.
from mapsbr import ibgemaps

states = ibgemaps.get_map("BR", including="states")
macroregions = ibgemaps.get_map("BR", including="macroregions")

ax = states.plot(color="white", edgecolor="gray")
macroregions.plot(color="white", edgecolor="midnightblue", alpha=.5, ax=ax)
ax.axis("off")
Out:
(-76.25719638750002, -26.577751022500017, -35.70252919050001, 7.2289130005)
Total running time of the script: ( 0 minutes 3.114 seconds)
Estimated memory usage: 90 MB