Note
Click here to download the full example code
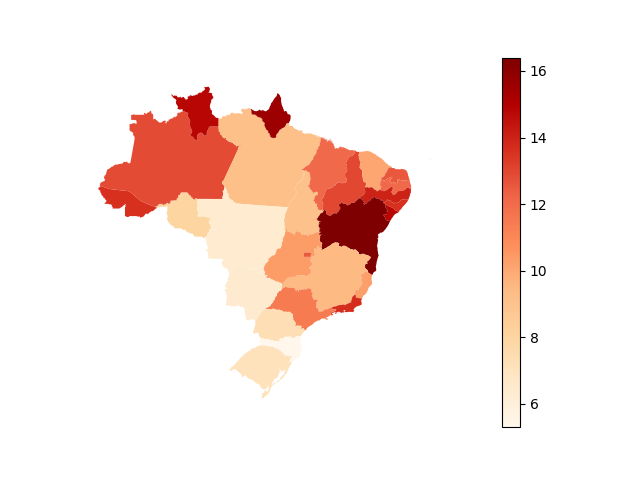
Unemployment rate by state
In this example we’ll visualize the most recent data on brazilian unemployment per state.
Let’s again retrieve the data with the seriesbr package.
from seriesbr import ibge

df = ibge.get_series(
    4095, 4099, last_n=1, states=True
)
Now let’s convert this DataFrame into a GeoDataFrame after getting the
geometric objects for each state.
import geopandas as gpd
from mapsbr import ibgemaps

df = df.assign(geometry=ibgemaps.geocode(df["Unidade da Federação (Código)"]))
gdf = gpd.GeoDataFrame(df)
Now let’s plot it.
import matplotlib.pyplot as plt

fig, ax = plt.subplots()
ax.axis("off")

gdf.plot(column="Valor", cmap="OrRd", legend=True, ax=ax)
plt.show()
Total running time of the script: ( 0 minutes 10.393 seconds)
Estimated memory usage: 9 MB