Note
Click here to download the full example code
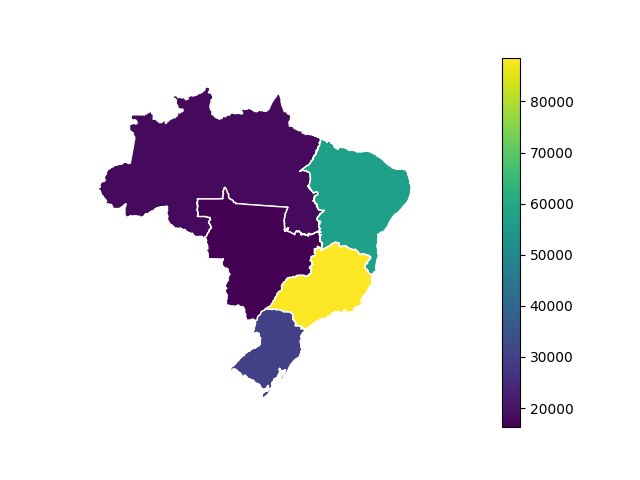
Population by macroregion
In this example we want to visualize the most recent data on brazilian population by macroregion.
Let’s first retrieve the data with the seriesbr package.
from seriesbr import ibge

population = ibge.get_series(6462, 606, macroregions=True, last_n=1)
Then let’s convert this DataFrame into a GeoDataFrame by assigning
to a column named “geometry” the macroregions’ geometric objects.
You can get a geometric object for a given location with the function
mapsbr.ibgemaps.geocode(). It can either be a location code or name. If
it’s a name, you’ll need to pass which is its geographic level to avoid ambiguity.
For example, ibgemaps.geocode("Rio de Janeiro", geolevel="state") if you want Rio
de Janeiro state map or ibgemaps.geocode("Rio de Janeiro", geolevel="municipality") if
the map for Rio de Janeiro city.
Notice that the column with the geometric objects has to be named geometry. Otherwise
you’ll need to call the set_geometry("geometries_column") method on the
GeoDataFrame.
import geopandas as gpd
from mapsbr import ibgemaps

gdf = gpd.GeoDataFrame(population)
gdf["geometry"] = ibgemaps.geocode(population["Grande Região"], geolevel="macroregion")
gdf.plot(column="Valor", legend=True, edgecolor="w")

import matplotlib.pyplot as plt

plt.gca().axis("off")
plt.show()
Total running time of the script: ( 0 minutes 6.479 seconds)
Estimated memory usage: 21 MB