Tutorial
Let’s learn the basics on how to use each module.
ibgemaps
Maybe the most useful function here is mapsbr.ibgemaps.get_map(). It
lets you get geometric objects associated with a geographic space.
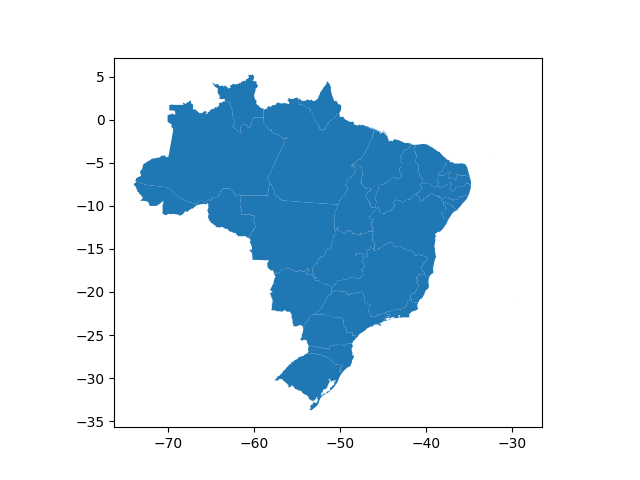
For example, if you want a map of Brazil including states, you’d call:
In [1]: from mapsbr import ibgemaps

In [2]: ibgemaps.get_map("BR", including="states").plot()
Out[2]: <matplotlib.axes._subplots.AxesSubplot at 0x7f914acad240>
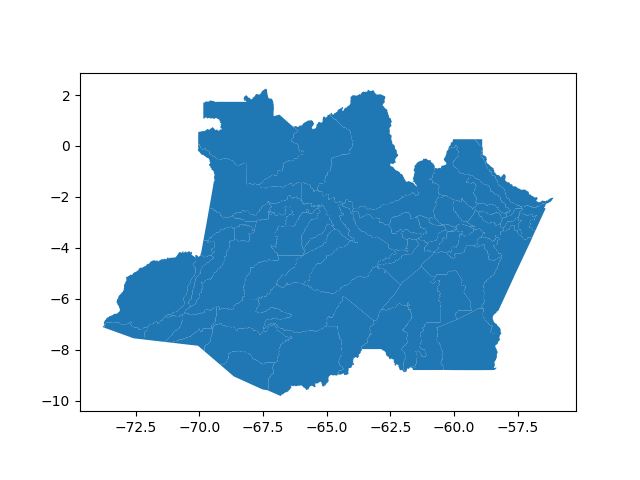
Or, supposing you want the Amazonas state map with municipalities, you would call:
In [3]: ibgemaps.get_map("Amazonas", including="municipalities", geolevel="state").plot()
Out[3]: <matplotlib.axes._subplots.AxesSubplot at 0x7f914b7bdd68>
Notice that you need to specify if it is a state, a municipality, etc., the location geographic level. This avoid unambiguity, e.g., “Rio de Janeiro” is both a state and a municipality.
Another useful function is mapsbr.ibgemaps.geocode(), which is a more
specialized function to convert locations names into geometric objects (it doesn’t
return a GeoSeries like mapsbr.ibgemaps.get_map()).
In [4]: ibgemaps.geocode("Rio de Janeiro", geolevel="state")
Out[4]: <shapely.geometry.multipolygon.MultiPolygon at 0x7f914acbb550>
It’s useful when you want to convert a location names column into a geometry column:
In [5]: import geopandas as gpd

In [6]: states = ["Rio de Janeiro", "Minas Gerais", "São Paulo", "Espírito Santo"]

In [7]: gdf = gpd.GeoDataFrame({"states": states})

In [8]: gdf["geometry"] = ibgemaps.geocode(gdf.states, geolevel="state")

In [9]: gdf
Out[9]:
           states                                           geometry
0  Rio de Janeiro  (POLYGON ((-44.7189 -23.359, -44.7189 -23.359,...
1    Minas Gerais  POLYGON ((-40.2223 -17.9804, -40.2553 -17.9717...
2       São Paulo  (POLYGON ((-48.0017 -25.2488, -48.0017 -25.248...
3  Espírito Santo  (POLYGON ((-40.3959 -20.6221, -40.3959 -20.622...
arcgis
This module provides a general API to retrieve data from an ArcGIS server, as some brazilian government institutions stores some interesting data in them, e.g. IBGE.
As you want geospatial data, you’ll most likely be looking for a MapServer type of service in the ArcGIS server. They may be in the “Services Directory” on in a subfolder within it.
To help you browse the available options you can use the functions
mapsbr.arcgis.folders() or mapsbr.arcgis.services(), which
will list all folders and services in a server, respectively.
As it shall be illustrated next, by default it will search in a IBGE server.
In [10]: from mapsbr import arcgis

In [11]: arcgis.folders()
Out[11]:
           0
0  Utilities

In [12]: arcgis.services().head()
Out[12]:
        name       type
0   AGRICOLA  MapServer
1  atlas_mun  MapServer
2   atlas_uf  MapServer
3    BASEMAP  MapServer
4      BIOMA  MapServer
Now, imagine you’re interested in FAUNA service. You can take a look at the available feature layers like this:
In [13]: arcgis.layers("FAUNA")
Out[13]:
    id                  name
0    0                 Geral
1    1              Anfíbios
2    2                  Aves
3    3  Outros Invertebrados
4    4               Insetos
..  ..                   ...
14  14                Peixes
15  15                  Aves
16  16             Mamíferos
17  17               Répteis
18  18          Uso da Terra

[19 rows x 2 columns]
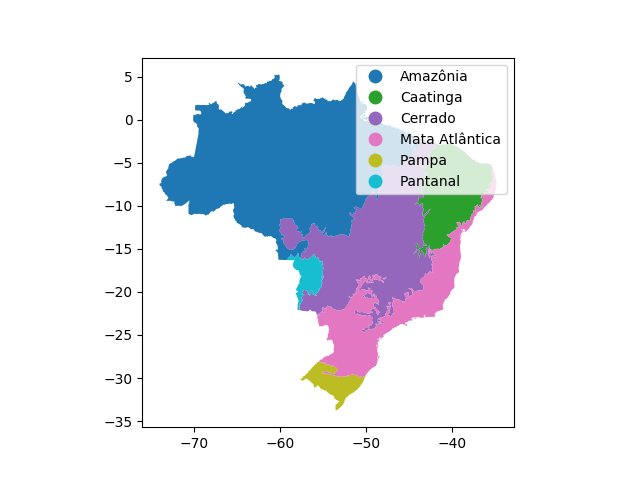
Now, to get an actual layer, call mapsbr.arcgis.get_map():
In [14]: arcgis.get_map("BIOMA", layer=0).plot(column="NOME", legend=True)
Out[14]: <matplotlib.axes._subplots.AxesSubplot at 0x7f9146a89080>
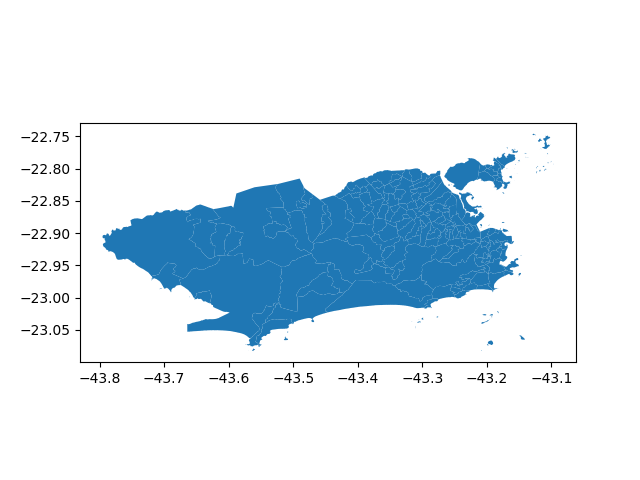
If you want to get a feature layer from another ArcGIS server, you will need to specify its URL. For example:
In [15]: arcgis.get_map(
   ....:     service="Basicos/mapa_basico_UTM",
   ....:     layer=15,
   ....:     baseurl="https://pgeo3.rio.rj.gov.br/arcgis/rest/services/",
   ....: ).plot()
   ....:
Out[15]: <matplotlib.axes._subplots.AxesSubplot at 0x7f914ac3d3c8>